Mechanical properties and viscoelasticity
One of the big advantages of thermoplastic materials is that they enable shaping into very intricate geometries in a single operation, for instance by injection moulding. In order to save material and to keep process cycle times as short as possible, i.e. required cooling time, the dimensions of the products should be minimized at all times. However, to make sure the product will withstand the loads and deformation it will face in service, it must be possible to simulate the stresses and strains generated and to compare these to tabulated mechanical properties data. Primarily there is a need to quantify tensile and shear properties but also long term data are highly relevant to judge whether or not the product will fulfil its requirement specification. Polymeric materials most often have time dependent mechanical properties. This is called viscoelasticity, which may be linear or non-linear. The former case is valid up to the point where also stress dependence appears. Above that stress the attainable simple and robust linear viscoelastic models lose validity.
Tensile testing is the most common and convenient way to determine a material’s short term mechanical properties. A sample with a uniform cross sectional area is clamped at a certain distance between clamps that are pulled apart with a linear velocity while registering force [N], elongation [ΔL] and contraction [Δt] using load cell and extensometers respectively. These parameters are normalized by dividing the force by cross-sectional area to get the normal stress, σ0, and the elongation by the original length to get the normal strain, ε. By the use of Hook’s law, Eq. (6) the Young’s modulus can be determined.
σ = E·ε
(6)
Based on the transverse strain also the Poisson’s number, ν, can be determined. From the Young’s modulus and the Poisson’s number also the shear modulus, G, may be calculated from equation (7).
E = 2G(1+ν)
(7)
The Poisson’s number is in the range of 0 to 0.5 where the upper limit, only found in rubber, means that there is no volume change. For all other materials a deformed sample increases its volume. Figure 10 illustrates a schematic tensile testing graph of a typical ductile polymeric material. From the linear initial part of the curve the Young’s modulus can be determined. The ultimate stress and strain are given by the curve end-point while the yield stress is where the initial linear part levels off and the sample starts to deform permanently.
Thermoplastic polymers, as their name indicates, are highly sensitive to temperature and go through a number of stages as illustrated in figure 11. At low temperature, indicated by I in the figure, is the glassy state, II – the transition zone with Tg at the inflection point, III – the rubbery plateau and finally IV – the viscous zone. Each material has its characteristic figure 11-type curve and there are also structural and morphological factors that alter its appearance. Higher molar mass extends zone III to higher T. The drop of E in the transition zone, which for an amorphous polymeric material is about 1000 times, is less and less pronounced with increasing degree of crystallinity. A similar pattern is seen with increasing degree of cross-linking.
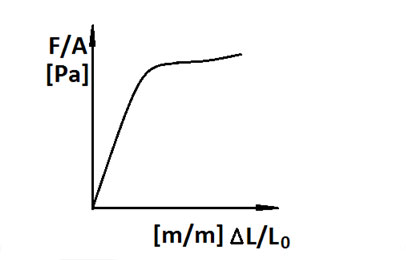
Figure 10. Schematic stress-strain curve from tensile testing
© Anders Persson, University of Borås
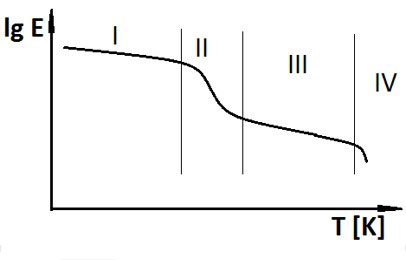
Figure 11. Schematic temperature dependence of Young's modulus
for an amorphous thermoplastic material
© Anders Persson, University of Borås
The pattern seen in Figure 11 may actually also be attained by exchanging the temperature for loading time. This is a manifestation of viscoelasticity and is based on the fact that deformation depends upon conformational rearrangements and with time the likelihood that the polymers will move in a way that releases stress. Accordingly harmonic loads of different frequencies will follow a similar pattern since frequency is reciprocal time, i.e. low frequency is equivalent to long loading time.
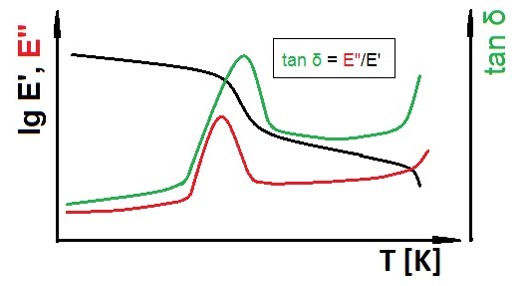
Figure 12. A schematic illustration of DMTA data
© Anders Persson, University of Borås
A very powerful way to describe viscoelasticity and thermal behaviour is DMTA. It is based on the fact that the response to an applied stress will cause a deformation time lag for a viscoelastic material. Alternatively, a deformation is applied and the stress will lag behind in the same way. By this methodology the storage modulus (in phase with the applied stimulus), E’ and the loss modulus (half a cycle behind the stimulus), E’’ can be determined. Furthermore, the ratio of E’’/E’, which in vectorial terms becomes tan δ. The vectorial sum of E’ and E’’, becomes E*, which is the normal E that a material responds by without any details on lag effects.
As shown in Figure 12 the tan δ peak is very pronounced and it is related to the Tg. There is no consensus what should be the designated parameter for the Tg, the E’ inflection point, the E’’ or tan δ peaks. They are all also both frequency dependent and heating rate dependent. A further limitation of DMTA is that it requires mechanical integrity of the samples. Thus, Tg is difficult to study for a completely amorphous sample. Accordingly the melting of a semicrystalline sample is not attainable unless it is also cross-linked or contains some other kind of reinforcement.
Other commonly used manifestations of viscoelasticity are creep and stress relaxation tests. During a creep test a sample faces a constant stress and the strain is monitored while a stress relaxation test means that a sample is faced by an immediate deformation followed by stress monitoring.
There are two simple mathematical models that can mimic these responses where the Kelvin-Voigt best mimics the creep behaviour while the Maxwell best describes stress relaxation. Both models are presented in Figure 13. Figure 14 illustrates the response to a stepwise strain and how the stress in the sample levels off. After a certain time denoted τ, the relaxation time has been reached, which equals the ratio of the dash-pot viscosity η to the Young’s modulus E as τ = η/E.
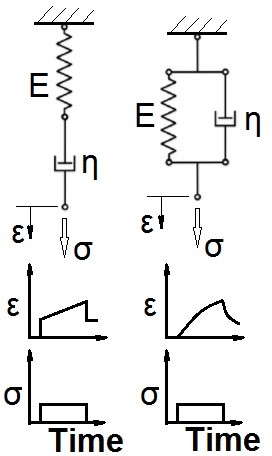
Figure 13. Schematic description of Maxwell (upper left) and Kelvin-Voigt (upper right) viscoelastic models and descriptions of their strain responses to creep
© Anders Persson, University of Borås
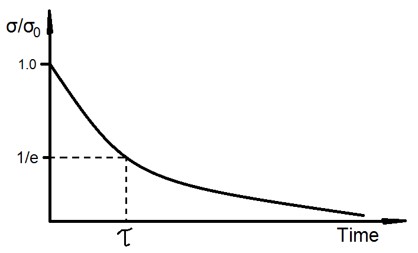
Figure 14. Schematic relaxation curve described by the Maxwell model
© Anders Persson, University of Borås
Mathematically the Kelvin-Voigt and Maxwell models for creep and stress relaxation may be expressed as:
(8)
(9)
As seen from equations 8 and 9 the parameters are exactly the same. This means that it is enough to conduct one of the two tests in order to be able to predict the other one.
A polymeric material that has reached the viscous state, zone IV in Figure 11 has lost its mechanical integrity and is now considered a fluid with mainly viscous behaviour. The Kelvin-Voigt and Maxwell models are still valid but with significantly shorter relaxation times than in the solid state. Hence it is more relevant to use a purely viscous fluid as a starting point, i.e. a model with only a dash-pot and also to emphasise shear flow rather than tensile. The stress-deformation behaviour depends on the shear rate, dϒ/dt, a fluid experiences in accordance with equation (10).
τ = η·dϒ/dt
(10)
Observe that τ denotes shear stress, NOT relaxation time, while ϒ is the shear angle and its time derivative is how quickly the angle changes, i.e. dϒ/dt. A fluid that obeys equation (10) is called a Newtonian fluid and has a viscosity, η with unit [Pa s] that is constant at all shear rates. This is rarely the case for polymers that have tendencies to align along the flow field, which causes a viscosity drop since they slide more easily along one another than when they are randomly distributed. Such behaviour is referred to as shear thinning.
All efforts have been made to ensure materials created by the EDU comply with current accessibility guidelines (JISC: Support for learners with disabilities).
If further assistance is required with accessibility matters please contact the student support section in your academic partner UHI: Accessing learner support.
We welcome any comments on how to improve this unit. Please feel free to pass these on at any time.
If you have any difficulty viewing this resource please contact EDU (edu@uhi.ac.uk) with:
- the name of the resource;
- a description of the problem (please give as much detail as possible);
- the section of the resource where the problem occurred;
- your internet browser (you can check your browser version at: http://detectmybrowser.com/).
UHI provides links to external sources of information and may refer to specific Web sites, products, processes or services within this resource. Such references are examples and are not endorsements and whilst every effort is taken to ensure the accuracy of information provided UHI is not responsible for any of the content or guidance. You are advised to exercise caution.
Audio
Video
Reading
Download
Information
External link
Activity
Question
Asterisk
Discussion
Collaboration
Reflection/journal/log
History
Pause for thought
Download a copy of this resource in PDF format.
You can also print individual pages by printing directly from the browser.